So why would you want to build your own DSM? I'm glad you asked!
Have you ever had a log source you would like QRadar to parse but IBM does not support it at this time?! Then you need to know how to build your own.
So I put together what I assume is a unique log pattern as shown below
----------- start of sample logs ------------
Fri Mar 21 15:10:49 2014: hostname:10.0.0.1 info:Backup Started by user:admin pid:27387 source: 10.0.15.20 sport:12345 destination:192.168.0.100 dport:22 protocol:tcp
Fri Mar 21 15:10:49 2014: hostname:10.0.0.1 info:Backup Started by user:root pid:27387 source: 10.0.15.20 sport:54321 destination:172.16.0.20 dport:22 protocol:udp
Fri Mar 21 15:10:49 2014: hostname:10.0.0.1 info:Backup Started by user:test pid:27387 source: 10.0.15.20 destination:10.11.12.13 protocol:icmp
----------- end of sample logs ------------
Now that we have our logs, let's identify the information which we can extract as it relates to the Log Source Extension (LSX) Template. The information of importance to me are:
DATE_AND_TIME
HOSTNAME
EVENT_NAME
USERNAME
SOURCE_IP
SOURCE_PORT
DESTINATION_IP
DESTINATION_PORT
PROTOCOL
The above matches quite well with what is in the template which can be downloaded from IBM support forums or below. As a result I take out the "pattern id" and the corresponding "matcher" for the ones which I do not plan to use. Examples of these are;
<pattern id="EventCategory" xmlns=""><![CDATA[]]></pattern>
...
<matcher field="EventCategory" order="1" pattern-id="EventCategory" capture-group="1"/>
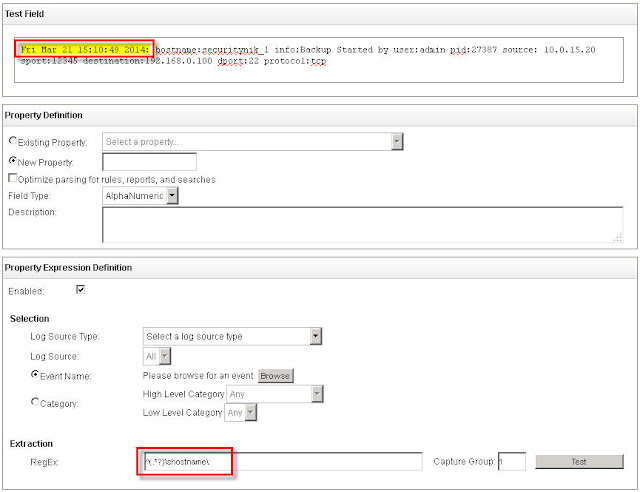
"Custom Event Properties", let's use that to build and test our Regex.
In my case, my regex look as follows without the quotes and all uses "Capture Group" 1
DATE_AND_TIME - Regex: "^(.*?)\shostname\:"
HOSTNAME - Regex: "\shostname\:(.*?)\sinfo"
EVENT_NAME: - Regex: "\sinfo\:(.*?)\:"
USERNAME - Regex: "\Started\sby\suser\:(.*?)\spid"
SOURCE_IP - Regex: "\spid\:\d{1,5}\ssource\:\s(\d{1,3}\.\d{1,3}\.\d{1,3}\.\d{1,3})\ssport\:"
SOURCE_PORT - Regex: "\ssport\:(\d{1,5})\sdestination\:"
DESTINATION_IP - Regex: "\sdestination\:(\d{1,3}\.\d{1,3}\.\d{1,3}\.\d{1,3})\sdport"
DESTINATION_PORT - Regex: "\sdport\:(\d{1,5})\sprotocol\:"
PROTOCOL - Regex: "\sprotocol\:(tcp|udp|icmp)"
To access the "Custom Event Properties" from the "Admin" tab, select "Custom Event Properties" then "Add".
Note this is for testing so please don't select "Save" once completed.
See below for the example in which I extract the date and time from the logs.
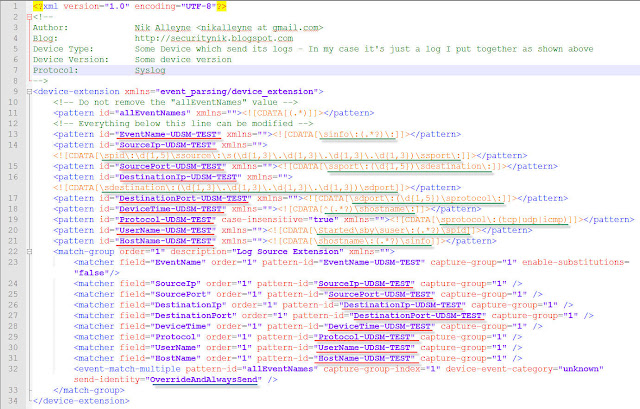
Now that we have our regex, let's build out our Log Source Extension (LSX)
I will append "-UDSM-TEST" to all the pattern ids. (I don't think this is needed but it is recommended that you append something to the default).
Next I will incorporate my regex in the various field. To do this, the regex needs to be placed beteween the CDATA. So "<![CDATA[]]>" now becomes "<![CDATA[MY REGEX GOES IN HERE]]>"
Additionally, because I have username (identity data) in the log, I will change 'send-identity="OverrideAndNeverSend"' to 'send-identity="OverrideAndAlwaysSend"'
Now that we have built our LSX, let's look at uploading this to QRadar.
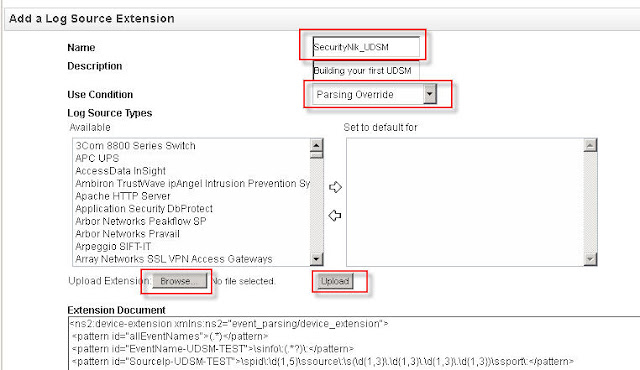
From the "Admin" tab, select "Log Source Extensions". From this window now select "Add". Enter your UDSM name and select "Browse" to select your file and then "Upload" to .... well you guessed it upload the file.
If there is no issue, you should see your file loaded in the screen below. If you encounter errors, then you will need to address the issue in your LSX file. Once all is good, click "Save"
Below shows what a successful upload looks like. Provide the name and ensure that the "Use Condition" is set to "Parsing Override".
Adding your log source
Now that we have our LSX. Let's add the log source which will be forwarding the logs.
From the "Admin" tab select "Log Sources". From the "Log Sources" window, click "Add".
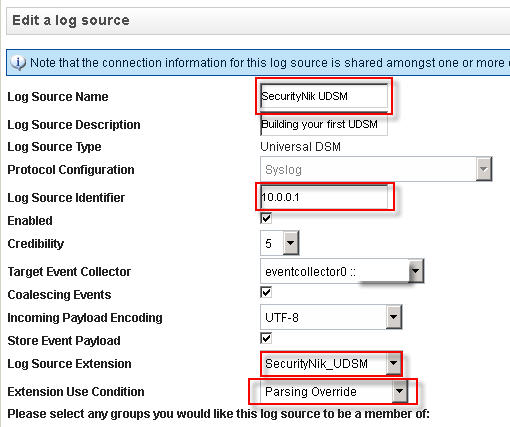
Once you have finished creating your log source, it is time to now "Deploy Changes" under the "Admin" tab.
So we have made progress but obviously we still have issues as some part of the log activity still shows unknown. Consider this good news as at least we know the data is being seen in QRadar.
Let's next double click on one of the "unknown" events. From the window select "Map Event". The objective here is to provide QRadar with an understanding of what the previous values represent, thus we need to map these to their equivalent QID.
Now that we have clicked "Map Event", let's go ahead and provide the necessary mappings.
Once everything goes well, you should see the following "The event mapping has been successfully saved. All future events matching these criteria will be mapped to the specified QID." which in this case is "59500166"
Voila, there you go, you have now built your first UDSM.
As always, hope you enjoyed reading this post. Maybe you can leave a comment to let me know if this was helpful.
If you use QRadar and would like me to consider doing more work on specific areas of QRadar leave a comment and I will see what's possible.
For further guidance on this see the references below:
References:
My LSX Example
https://www.ibm.com/developerworks/community/forums/html/topic?id=77777777-0000-0000-0000-000014970193
Saturday, April 2, 2016
Intelligence Driven Cyber Analysis
Recently I
was having a discussion about the importance of ensuring proper context,
relevance and intelligence is provided when performing analysis of cyber
related activities. Fortunately for me, a few days after, this article was published. While the article
makes for very interesting read, the quote I like the most is “Network defenders who rely solely on
lists of assets to protect are running a fool’s errand.”
As cyber security
professionals or responsibilities start with first identifying the business’s
critical assets not identifying the next new shiny technology and or tool.
Once, we identify and understand our critical assets then we identify the
technologies which may help the business protect and or secure those assets.
Once we have cleared the two previous hurdles making the best use of the
technology and securing the business and its assets goes beyond just the
technology.
Most of the tools you
will use, will generate some type of events which may result in an alert. The
question is when you get that alert what do you next. Do you simply accept that
alert and decide whether to act or not?! What is the context of the alert? What
about relevance? Is the message which is generated relevant to your
environment? Is the alert seen across one or more of your tools? Do you have
full packet capture to look into the payload to ensure clarity? What additional
intelligence do you have to support your conclusion? The point here is to
ensure that you have as much data/intelligence from as much possible sources. It
is very important that we understand that the sources of intelligence can be
from one or more blacklist of bad IPs, domains and or URLs. It can be from end
users who detected something of concern. It could be from a business partner.
It can be from vulnerability data. It can be from … well you get the message.
It can come from anywhere. However, no matter where it comes from, make sure it
is relevant to your environment and identify the context within which it
relates to your environment
Ultimately as a
result of the alerts received from your tools, you should have only one of two
end result. You should either be tuning out the alert if it is a false positive
or act on it (take the host off the network, take a memory dump for later analysis, wipe, run antivirus, perform live analysis, etc) if it is
a true positive. There should be no instance in which you simply ignore the
message, it will do neither you nor the business any good.
5 tips for tuning your cyber security environment
Tuning your environment is the only way to ensure that you
are not drowning in alerts and or some other form of notification. To help you optimize your tuning I suggest the
following. Note these tips are not
related to any one tool but can be used as general guidance.
1.
Add enough intelligence to your tools during
build out. Your cyber security tools may have the ability to injest
vulnerability data, build out networks which are owned, identified and classify
critical assets, etc. Take full advantage of these features where possible as
the amount of planning you do upfront can have a significant impact on how much
tuning, massaging and or time you will need to spend with your tool(s).
2.
Never (unless absolutely needed) tune out an
entire host.
Meaning, if host 10.0.0.1:5000 ->
10.0.0.2:22 generated an alert and you think it is false positive, then tune
out (where possible) the source host and destination host/port. This ensure
that the legitimate communication does not create unnecessary alerts, while
allowing anything else to generate alerts for those hosts. It is important
however to understand even by narrowing the tuning to the specific source host
and destination host/port, there is still a risk that malicious content can be
passed. However, the risk when compared to the number of alerts which may be
generated has to be weighed. From my perspective, the tuning option is worth
the risk
3.
Disable unused rules for services which are not
used
If there is not a specific service(s) running
in your environment, then there should be no need expending resources looking
for this type of traffic. Obviously, this will not always work for everyone. As
someone may wish to identify when these services do come online. I believe
there are better ways for looking for when unsupported services and or devices
are brought online. As a result, I believe the risk here when disabling rules
for unused services is pretty low, so I have no problem with disabling these
rules.
4.
Time is important
If you are aware that certain activities
are legitimate from specific source and destination during certain hours, then
ignore by tuning out those activities within those time window and focus on
monitoring the activities outside of the time window. Examples of this would be where there are
specific remote jobs such as backups, file transfers, service accounts being
used, etc. Monitoring these activities outside of business hours, may help to
shed more light on what else they may be used for other than their intended purposes.
5.
Monitor what is important
Last but surely not least is monitoring
what is important. Yeah we would like to monitor everything. However, the
question I like to ask is will you action everything?! Most times the answer to
that question will not be “no” but rather it will be “I can’t”. The fact that
your tool(s) generate a “ton” of alerts only suggest that your tool is working,
it does not say it is efficient. Make it efficient by only monitoring what is
considered important.
Hope you enjoyed these 5 tips. Feel free to
submit your comments with any suggestions you have that you think may be just
as, less than or even more important.
Subscribe to:
Posts (Atom)