Sunday, July 10, 2016

Building a monitoring solution – Hardening the OS - CentOS 7 (Linux)


Having decided to build your own monitoring solution, once the OS has been installed, your next step should be to harden it. In considering the steps needed for hardening your OS, it is best if you take advantage of existing best practices and customized them to your specific environment and its’ requirements. In this post, we will take advantage of some guidance from various sources such as Center for Internet Security (CIS), RedHat, SANS and NIST 800-123 (not necessarily in that order).


Leveraging the NIST 800-123 guidelines, let’s break this out into sections, so that we identify our areas of focus. NIST recommends we focus on the following:             

- Patch and upgrade the operating system

- Ensure unwanted software are not running

- Configure operating system user authentication

- Configure resource controls

- Install and configure additional security controls, if needed

- Once the above are completed, it then recommend that we test our  operating system by looking at the output from NMAP and or Nessus


Removing Unnecessary Software
Before we look at patching and upgrading, let’s take a look at what is currently running with our default “minimal” install of CentOS 7.
To understand what is running on our system, let’s run “netstat”... Ooooops!! When you try to run “netstat”, the command is not found. This means we have to install the package since it is not installed with the “minimal” install. First thing you probably should do is perform a “yum search neststat” to find the related package.

Once you have found it, next perform an install using “yum install net-tools”.

Next we run “netstat -nlutp” to identify the listening UDP and TCP ports.


This is good information and from the above we see that we have services listening on port 25 (SMTP) and 22 (SSH). We will keep SSH for now but see no need for a mail server on this box. So before we upgrade, let’s remove unwanted services. In this case we will remove SMTP (2699/Master).


“yum remove postfix” will remove postfix from our install. This is one less software for us to upgrade, manage and or harden, as it is not needed.

Additionally, you could execute “chkconfig --list” or “systemctl list-unit-files | grep enabled” or “systemctl list-units | grep service” to see what may be configured to start up at boot time.


Updating existing software
Ensuring that our system stays updated, is an important step. Trying to manually manage your updates can become an exercise which you loose interest in. As a result it makes much sense if you have a script or some other automated process to check and or update your installation at least daily. Beware that automatic updates may cause unexpected issues as updated software may break your existing installation.
Let’s setup a cron job by editing the “crontab” with the command “crontab –e” adding the entry “01 00 * * * /usr/bin/yum update -y > /tmp/yumUpdate.log 2>&1”. This command ensures we attempt to update our system on the first minute of every 0 hour of everyday. Basically, we are updating at 12:01 AM daily.

Configuring user authentication
The next most important step is controlling user access. For starters when we perform a “cat /etc/passwd” we see a number of user accounts which are not needed for our install.


Now that’s a lot of users. Let’s reduce the list to something that is a bit more reflective of what we would like to see. To remove some of these users, along with home directory, etc. run the command “userdel --remove --force”. In this example, we delete ftp, postfix, operators, games and polkitd. It is important here to not just delete users for deleting purposes. Some of these accounts may be used by processes which you are not aware of.
To now add a user, let’s execute the command “useradd --comment "Nik Alleyne" --create-home --shell /bin/bash nik”. This will create user “nik” and then we execute “passwd nik” to set our password.


I then modified the user to add the “nik” account to the “wheel” group using the command “usermod --groups wheel nik”. This ensures that the “nik” account can perform “sudo” operations as the “wheel” group is part of the “sudoers” file and is not commented.

Let’s also modify the “/etc/login.defs” to control how passwords are used. We will set the max password days to 180, min pass days 7, min password length 10 and let’s give ourselves 14 days of warning before the password expires.


Let’s wrap up user access by configuring how SSH is accessed from the network. We will set the Login grace time to 2 minutes, while at the same time disabling root login. Maximum tries for authentication would be 6 and allow up to 3 SSH sessions at once.


Another critical component for us is to ensure NTP is installed, configure and hardened to synchronize time..

We will leverage the following 4 servers for time synchronization within our "/etc/ntp.conf".


Now let’s verify our time is properly synchronized.

The above says our time is synchronize, so let's move on.


Testing our OS
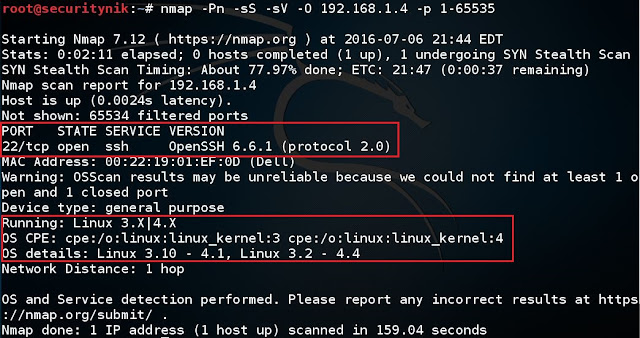
Now let’s assume we did all the hardening steps recommended from these documents which are applicable to our environment, the next step would be to run a VA Scanner or some other utility against the server. For our purposes let’s run NMAP to see what shows up.

Below we run a NMAP Syn Scan against the host while at the same time trying to determine the services and versions. The results show Open SSH 6.6.1 is running on port 22. This scan tests all TCP ports from 1-65535.

Additionally you should test all the UDP ports which may be opening on your system.


Obviously, there is a lot more to configure when leveraging these guides. My recommendation is you continue going through these guides to get a good grasp of what is required for hardening your environment. You may not need to set every option. However, it is important that you know your environment and the options which are available to you.


See you in the next post where we configure Palo Alto to forward its logs to our monitoring solution which will be running free Splunk


Friday, June 10, 2016

Building a Forensically capable network infrastructure

Recently I was invited by the Ottawa Chapter of the High Technology Crimes Investigation Association (HCIA) to do a presentation as I was in Ottawa, Ontario teaching the SANS 503 - Intrusion Detection in Depth class. The topic I choose to speak on was "Building a Forensically capable network infrastructure".

What do I mean by forensically capable network?


- A network which allows a forensic investigator, network security analyst, intrusion analyst, etc., to be able to retrace the steps of any (potential) security issue which may be identified, thus allowing them to not only fix the current issue but prevent and or mitigate it in the future.

- These issues may include but not limited to identification of fraud, policy violations, security incidents, auditing, forensic investigations, inappropriate usage, etc

- While this can also be done for operational purposes such as establishing baseline, identifying operational (d)efficiencies, the objective of this presentation is strictly from bullet 2’s perspective


To read more download the presentation here.

Sunday, May 1, 2016

Locky Ransomware Analysis - Analysing through Process Explorer

Picking up from where the last post left off, we noticed that the "Locky.exe" process exited. However, we also noticed that it created the file "svchost.exe".

Because of the image path we monitored in Process Monitor, we were unable to see if the "svchost.exe" process was loaded and what was done. Lets use process explorer to see if the "svchost.exe" which was created was executed and is still running.

As we launch Process Explorer, from the "view" menu deselect the "show process from all users".

Next from the "options" menu, we select "Verify Image Signatures".


From above the above we see that the "svchost.exe" does not have a verified signature.

Additionally, its  a process which does not seem to have a parent. While a system can have multiple "svchost.exe" processes, these processes in most cases are always a child of "services.exe". This "svchost.exe" stands by itself.

Now that this process is deemed suspicious. Lets dig deeper into it.

Looking at the image data below, the first thing that stood out to me was build time in year 2005.


I found this interesting as I'm using Windows 10 so I expect the build time to be more recent.

Next, from above we see the path and the command line representation of the path which was created when Locky.exe was loaded.


Additionally, we see the current directory is "c:\locky\locky". On a typical Windows system this would be " %WINDIR%\system32\"

Finally, we see the partent process is non-existent. We already know that the parent process exited.

The next item that stood out immediately was the difference between the strings on disk and the strings in memory.

Image below shows a snapshot of the strings on disk.


Image below shows the strings in memory. Simply looking at the first few lines we can see an immediate difference.


Going through the strings in memory we see some interesting information which stands out. One of the things I found interesting about this was that the malware actually attempts to delete your volume shadow copies, thus making it harder for you to restore files from previous versions.


Below we see among other things that Locky will perform a HTTP POST to the site listed in memory.


At this point, I think we have enough information to be able to draw conclusions that we can remediate. The next step would be to kill the process and try to understand what is being requested from the URL which was found in the strings.
   
The final step in the process was to validate the "svchost.exe" against Virus Total. Lucky for me the file was already analyzed and had a detection ratio of 49/56 as shown below.   

   
Now that we've reached this stage, I think it is important to understand that I was not attempting to see how my files gets encrypted. We already know this is the purpose of Locky.  However, I deliberately did not connect my VM to the Internet, thus the "Locky.exe" executable was unable to successfully download the actual ransomware as the site which is found in memory was not available. Maybe a another time I will be able to use a different lab.

Artificat:
File
svchost.exe
SHA256:  bc98c8b22461a2c2631b2feec399208fdc4ecd1cd2229066c2f385caa958daa3
   

Locky Ransomware Analysis - Understanding its execution, looking for artificats with Process Monitor

As we continue this journey looking at Locky, let's see what it looks like in actual production.

Since my AV detected it in the previous post, in this post I will disable the AV and its features.

Next I loaded up Process Monitor and set the "Image Path" to "c:\Locky\Locky\Locky.exe"


I then executed Locky and found some artifacts. Note, I compared these to a "clean" version of Windows 10 before deciding that these are good artifacts.

Looking through process monitor, we can see the following


From the above we see that the "Locky.exe" process started. It then created a thread and started attempting to open registry keys which were not found. I'm assuming it was probably checking to see if those entries existed, which may have meant it was executed before. However, those entries were "NOT FOUND"

As we move forward we see our first set of registry artifacts.

First we see the creation of registry key "HKLM\SOFTWARE\WOW6432Node\Microsoft\Tracing\Locky_RASAPI32" and then we see that some values were set successfully and those values were then queried successfully.

While the items below cannot be used as artifacts, I thought it was important that I show some of the files which Locky tried to create but was unable to.

Something else that I found interesting is that Locky actually checks to see if specific Antivirus are installed. As we can see below, it is querying the registry looking for Kaspersky Lab, ESET and Avast. In the three cases shown below the values were "NOT FOUND"

Additionally, we see another registry artifacts in the successful creation of the key "HKCU\Software\Locky" and settings its value.


As we begin to look at the artifacts written to the disk, we see that the file "svchost.exe" was created in "%USERPROFILE%\AppData\Local\Temp\"


Next we see things start to get even more interesting with Locky creating a new process "cmd.exe". This process was executed with PID: "3636" and command line arguments. "cmd.exe /C del /Q /F "C:\Users\SECURI~1\AppData\Local\Temp\sysFAE3.tmp"


What the command is doing is basically "cmd.exe" is executing the specified command which is basically to delete quietly and force the deletion of some ".tmp" files in the "Temp" folder.

Finally, we see Locky process exists and closes.

At this point while we detected some artifacts, there is still information which we have not figured out. Do remember the "Locky.exe" process created other files and executed another process. Namely "svchost.exe". Let's dig a little deeper with process explorer in the next post.

Visible Artifacts
Files
%USERPROFILE%\AppData\Local\Temp\svchost.exe
Registry Entries
HKLM\SOFTWARE\WOW6432Node\Microsoft\Tracing\Locky_RASAPI32
HKLM\SOFTWARE\WOW6432Node\Microsoft\Tracing\svchost_RASAPI32
HKU\S-1-5-21-360379023-4285724796-1285974178-1001\SOFTWARE\Locky
HKCU\Software\Locky
HKLM\SOFTWARE\WOW6432Node\Microsoft\Tracing\EnableConsoleTracing: 0x00000000
HKLM\SOFTWARE\WOW6432Node\Microsoft\Tracing\Locky_RASAPI32\EnableFileTracing: 0x00000000
HKLM\SOFTWARE\WOW6432Node\Microsoft\Tracing\Locky_RASAPI32\EnableAutoFileTracing: 0x00000000
HKLM\SOFTWARE\WOW6432Node\Microsoft\Tracing\Locky_RASAPI32\EnableConsoleTracing: 0x00000000
HKLM\SOFTWARE\WOW6432Node\Microsoft\Tracing\Locky_RASAPI32\FileTracingMask: 0xFFFF0000
HKLM\SOFTWARE\WOW6432Node\Microsoft\Tracing\Locky_RASAPI32\ConsoleTracingMask: 0xFFFF0000
HKLM\SOFTWARE\WOW6432Node\Microsoft\Tracing\Locky_RASAPI32\MaxFileSize: 0x00100000
HKLM\SOFTWARE\WOW6432Node\Microsoft\Tracing\Locky_RASAPI32\FileDirectory: "%windir%\tracing"
HKLM\SOFTWARE\WOW6432Node\Microsoft\Tracing\svchost_RASAPI32\EnableFileTracing: 0x00000000
HKLM\SOFTWARE\WOW6432Node\Microsoft\Tracing\svchost_RASAPI32\EnableAutoFileTracing: 0x00000000
HKLM\SOFTWARE\WOW6432Node\Microsoft\Tracing\svchost_RASAPI32\EnableConsoleTracing: 0x00000000
HKLM\SOFTWARE\WOW6432Node\Microsoft\Tracing\svchost_RASAPI32\FileTracingMask: 0xFFFF0000
HKLM\SOFTWARE\WOW6432Node\Microsoft\Tracing\svchost_RASAPI32\ConsoleTracingMask: 0xFFFF0000
HKLM\SOFTWARE\WOW6432Node\Microsoft\Tracing\svchost_RASAPI32\MaxFileSize: 0x00100000
HKLM\SOFTWARE\WOW6432Node\Microsoft\Tracing\svchost_RASAPI32\FileDirectory: "%windir%\tracing"

Locky Ransomware Analysis - Will my AV help?

Considering there is so much about ransomware in the news and to some extent Locky, I thought I should take the opportunity to take a closer look at it to see if there is anything other than the obvious that someone may be able to do to mitigate the effects of being successfully targeted by a ransomware.

For the purpose of this post, I am using a virtual machine running Windows 10 with all the latest updates.


Additionally, I have some sample documents (.pdf, .txt, .xls, etc) and images,


One of the things I would like to know first up is if my Antivirus Comodo would be able to detect the first stage of the ransomware.

Ensure my Antivirus is up to date


Next up, I copied the ransomware from a USB into my Windows 10 VM. While copying, nothing was detected as malicious. It is quite possible that nothing was detected because Locky is contained in a password protected archive.


Once I extracted the file, it seems like Comodo detected it as a virus as I saw the file being extracted and then it disappeared. When I looked into the Comodo console, I see the file listed there as shown below.

Oh the question in my subject line is "Will my AV help?". The immediate take away from this is that an up-to-date antivirus can help with detecting Locky.

No need for me to do anything else here, time to disable the antivirus to see locky in action.

See you in the next post.

References
https://antivirus.comodo.com/

How I recovered my "lost" password - Burpsuite

Ahhhhhhhhhhhhh, sometimes the thought of having to remember your password can be frustrating, as a result we do all types of things to bring convenience. In my case I stored it in the browser for one part of the site but could not remember it for the other. So what did I do?

I opened the page for which my password was stored, similar to shown below.


Next, I loaded Burp,  enabled its listen proxy and configured my browser to use the local proxy which is now listening on 127.0.0.1 as shown below.

Burp listening proxy enabled


Firefox proxy configuration


Now that the proxy is listening and my browser is configured, time to access the website where my password is currently stored. In trying to access the site, the first thing that occurs is a certificate error.


Once I acknowledge the error, my authentication attempt was sent to Burp as shown below.


Next step is to send the password to the "Decoder"

Next I navigate to the "Decoder" tab and "Decode as" URL


That's it!! I recovered my password without having to change it.


Reference:
Burpsuite

Saturday, April 2, 2016

QRadar - Building your first Universal DSM (UDSM)

So why would you want to build your own DSM? I'm glad you asked!
Have you ever had a log source you would like QRadar to parse but IBM does not support it at this time?! Then you need to know how to build your own.

So I put together what I assume is a unique log pattern as shown below

----------- start of sample logs ------------
Fri Mar 21 15:10:49 2014: hostname:10.0.0.1 info:Backup Started by user:admin pid:27387 source: 10.0.15.20 sport:12345 destination:192.168.0.100 dport:22 protocol:tcp
Fri Mar 21 15:10:49 2014: hostname:10.0.0.1 info:Backup Started by user:root pid:27387 source: 10.0.15.20 sport:54321 destination:172.16.0.20 dport:22 protocol:udp
Fri Mar 21 15:10:49 2014: hostname:10.0.0.1 info:Backup Started by user:test pid:27387 source: 10.0.15.20 destination:10.11.12.13 protocol:icmp
----------- end of sample logs ------------

Now that we have our logs, let's identify the information which we can extract as it relates to the Log Source Extension (LSX) Template.  The information of importance to me are:
DATE_AND_TIME
HOSTNAME
EVENT_NAME
USERNAME
SOURCE_IP
SOURCE_PORT
DESTINATION_IP
DESTINATION_PORT
PROTOCOL

The above matches quite well with what is in the template which can be downloaded from IBM support forums or below. As a result I take out the "pattern id" and the corresponding "matcher" for the ones which I do not plan to use. Examples of these are;
<pattern id="EventCategory" xmlns=""><![CDATA[]]></pattern>
...
<matcher field="EventCategory" order="1" pattern-id="EventCategory" capture-group="1"/>

"Custom Event Properties", let's use that to build and test our Regex.

In my case, my regex look as follows without the quotes and all uses "Capture Group" 1
DATE_AND_TIME - Regex: "^(.*?)\shostname\:"
HOSTNAME - Regex: "\shostname\:(.*?)\sinfo"
EVENT_NAME: - Regex: "\sinfo\:(.*?)\:"
USERNAME - Regex: "\Started\sby\suser\:(.*?)\spid"
SOURCE_IP - Regex: "\spid\:\d{1,5}\ssource\:\s(\d{1,3}\.\d{1,3}\.\d{1,3}\.\d{1,3})\ssport\:"
SOURCE_PORT - Regex: "\ssport\:(\d{1,5})\sdestination\:"
DESTINATION_IP - Regex: "\sdestination\:(\d{1,3}\.\d{1,3}\.\d{1,3}\.\d{1,3})\sdport"
DESTINATION_PORT - Regex: "\sdport\:(\d{1,5})\sprotocol\:"
PROTOCOL - Regex: "\sprotocol\:(tcp|udp|icmp)"

To access the "Custom Event Properties" from the "Admin" tab, select "Custom Event Properties" then "Add".

Note this is for testing so please don't select "Save" once completed.

See below for the example in which I extract the date and time from the logs.


Now that we have our regex, let's build out our Log Source Extension (LSX)

I will append "-UDSM-TEST" to all the pattern ids. (I don't think this is needed but it is recommended that you append something to the default).

Next I will incorporate my regex in the various field. To do this, the regex needs to be placed beteween the CDATA. So "<![CDATA[]]>" now becomes "<![CDATA[MY REGEX GOES IN HERE]]>"

Additionally, because I have username (identity data) in the log, I will change 'send-identity="OverrideAndNeverSend"' to 'send-identity="OverrideAndAlwaysSend"'


Now that we have built our LSX, let's look at uploading this to QRadar.

From the "Admin" tab, select "Log Source Extensions". From this window now select "Add". Enter your UDSM name and select "Browse" to select your file and then "Upload" to .... well you guessed it upload the file.

If there is no issue, you should see your file loaded in the screen below. If you encounter errors, then you will need to address the issue in your LSX file. Once all is good, click "Save"

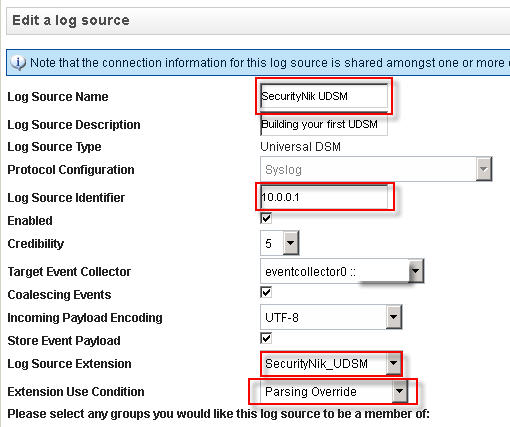
Below shows what a successful upload looks like. Provide the name and ensure that the "Use Condition" is set to "Parsing Override".


Adding your log source
Now that we have our LSX. Let's add the log source which will be forwarding the logs.
From the "Admin" tab select "Log Sources". From the "Log Sources" window, click "Add".


Once you have finished creating your log source, it is time to now "Deploy Changes" under the "Admin" tab.

So we have made progress but obviously we still have issues as some part of the log activity still shows unknown. Consider this good news as at least we know the data is being seen in QRadar.


Let's next double click on one of the "unknown" events. From the window select "Map Event". The objective here is to provide QRadar with an understanding of what the previous values represent, thus we need to map these to their equivalent QID.


Now that we have clicked "Map Event", let's go ahead and provide the necessary mappings.

Once everything goes well, you should see the following "The event mapping has been successfully saved. All future events matching these criteria will be mapped to the specified QID." which in this case is "59500166"
Voila, there you go, you have now built your first UDSM.

As always, hope you enjoyed reading this post. Maybe you can leave a comment to let me know if this was helpful.

If you use QRadar and would like me to consider doing more work on specific areas of QRadar leave a comment and I will see what's possible.

For further guidance on this see the references below:
References:
My LSX Example
https://www.ibm.com/developerworks/community/forums/html/topic?id=77777777-0000-0000-0000-000014970193

Intelligence Driven Cyber Analysis

Recently I was having a discussion about the importance of ensuring proper context, relevance and intelligence is provided when performing analysis of cyber related activities. Fortunately for me, a few days after, this article was published. While the article makes for very interesting read, the quote I like the most is “Network defenders who rely solely on lists of assets to protect are running a fool’s errand.”

As cyber security professionals or responsibilities start with first identifying the business’s critical assets not identifying the next new shiny technology and or tool. Once, we identify and understand our critical assets then we identify the technologies which may help the business protect and or secure those assets. Once we have cleared the two previous hurdles making the best use of the technology and securing the business and its assets goes beyond just the technology.

Most of the tools you will use, will generate some type of events which may result in an alert. The question is when you get that alert what do you next. Do you simply accept that alert and decide whether to act or not?! What is the context of the alert? What about relevance? Is the message which is generated relevant to your environment? Is the alert seen across one or more of your tools? Do you have full packet capture to look into the payload to ensure clarity? What additional intelligence do you have to support your conclusion? The point here is to ensure that you have as much data/intelligence from as much possible sources. It is very important that we understand that the sources of intelligence can be from one or more blacklist of bad IPs, domains and or URLs. It can be from end users who detected something of concern. It could be from a business partner. It can be from vulnerability data. It can be from … well you get the message. It can come from anywhere. However, no matter where it comes from, make sure it is relevant to your environment and identify the context within which it relates to your environment

Ultimately as a result of the alerts received from your tools, you should have only one of two end result. You should either be tuning out the alert if it is a false positive or act on it (take the host off the network, take a memory dump for later analysis, wipe, run antivirus, perform live analysis, etc) if it is a true positive. There should be no instance in which you simply ignore the message, it will do neither you nor the business any good.

5 tips for tuning your cyber security environment

Tuning your environment is the only way to ensure that you are not drowning in alerts and or some other form of notification. To help you optimize your tuning I suggest the following.  Note these tips are not related to any one tool but can be used as general guidance.

1.       Add enough intelligence to your tools during build out. Your cyber security tools may have the ability to injest vulnerability data, build out networks which are owned, identified and classify critical assets, etc. Take full advantage of these features where possible as the amount of planning you do upfront can have a significant impact on how much tuning, massaging and or time you will need to spend with your tool(s).

2.       Never (unless absolutely needed) tune out an entire host.
Meaning, if host 10.0.0.1:5000 -> 10.0.0.2:22 generated an alert and you think it is false positive, then tune out (where possible) the source host and destination host/port. This ensure that the legitimate communication does not create unnecessary alerts, while allowing anything else to generate alerts for those hosts. It is important however to understand even by narrowing the tuning to the specific source host and destination host/port, there is still a risk that malicious content can be passed. However, the risk when compared to the number of alerts which may be generated has to be weighed. From my perspective, the tuning option is worth the risk 

3.       Disable unused rules for services which are not used
If there is not a specific service(s) running in your environment, then there should be no need expending resources looking for this type of traffic. Obviously, this will not always work for everyone. As someone may wish to identify when these services do come online. I believe there are better ways for looking for when unsupported services and or devices are brought online. As a result, I believe the risk here when disabling rules for unused services is pretty low, so I have no problem with disabling these rules.

4.       Time is important
If you are aware that certain activities are legitimate from specific source and destination during certain hours, then ignore by tuning out those activities within those time window and focus on monitoring the activities outside of the time window.  Examples of this would be where there are specific remote jobs such as backups, file transfers, service accounts being used, etc. Monitoring these activities outside of business hours, may help to shed more light on what else they may be used for other than their intended purposes.

5.       Monitor what is important
Last but surely not least is monitoring what is important. Yeah we would like to monitor everything. However, the question I like to ask is will you action everything?! Most times the answer to that question will not be “no” but rather it will be “I can’t”. The fact that your tool(s) generate a “ton” of alerts only suggest that your tool is working, it does not say it is efficient. Make it efficient by only monitoring what is considered important.

Hope you enjoyed these 5 tips. Feel free to submit your comments with any suggestions you have that you think may be just as, less than or even more important.